The CBOE SKEW index, commonly referred to as the ‘black swan’ indicator, just spiked to the highest level in the indicators 25-year history.
Is this as scary as it sounds?
What is the SKEW?
The SKEW is calculated by the Chicago Board Options Exchange (CBOE), the same exchange that publishes the VIX.
Like the VIX, the SKEW is calculated from prices of S&P 500 out-of-the-money options. The SKEW Index basically attempts to quantify the odds of a black swan event (or S&P 500 tail risk).
CBOE identifies a black swan event as a two or more standard deviation move below the mean.
According to the CBOE, the black swan risk is negligible at a reading of 100. At 115, the risk is 6%, and at a level of 135, the risk of a black swan event is 12%. On Thursday the SKEW was at 151.22.
What is a Two Standard Deviation (Black Swan) Event?
Perhaps the easiest way to understand a two standard deviation event is with the help of Bollinger Bands.
The common default setting of the upper and lower Bollinger Band is two standard deviations above or below the 20-day SMA. The current spread between the S&P 500 20-day SMA and the Bollinger Bands is around 85 points (4%).
If you enjoy quality, hand-crafted research, >> Sign up for the FREE iSPYETF Newsletter
How Accurate is the SKEW?
The chart below captures the SKEW’s track record since the beginning of 2007.
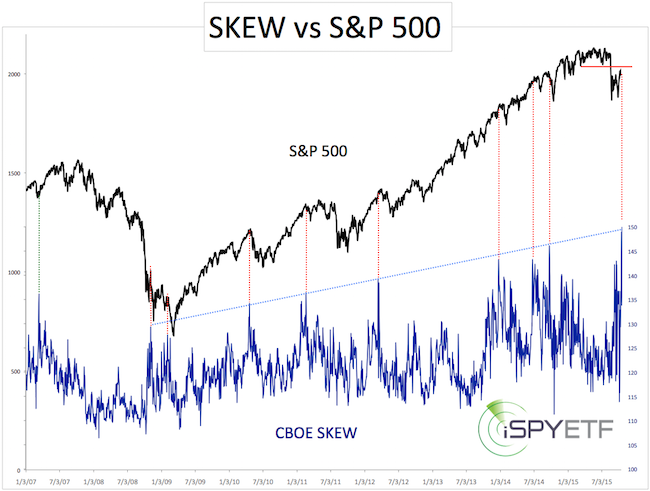
Here are a few things worth noting:
-
The SKEW has been moving higher since 2008, and it has taken ever-higher extremes to trigger a market reaction. It stands to reason that any stock market pullback (or black swan event) will not be commensurate to the 25-year SKEW extreme.
-
The S&P 500 almost always reacts to SKEW extremes. Either it 1) pulls back almost instantly or 2) eventually gives back several days/weeks worth of gains.
Context is Key
The SKEW extreme appeared just as the S&P 500 is approaching an important inflection zone. The September 13 Profit Radar Report stated:
“There is an open chart gap at 2,035.73. I am almost certain this gap will be filled (either during a wave 4 bounce or the subsequent rally). Depending on when we get there, 2,040 is an obvious candidate for a setup. It may be too obvious and subject to some sort of whipsaw, but 2,040 is the resistance level to watch.”
Best on the SKEW, there’s elevated risk of an upcoming pullback, especially around S&P 2,040.
Simon Maierhofer is the publisher of the Profit Radar Report. The Profit Radar Report presents complex market analysis (S&P 500, Dow Jones, gold, silver, euro and bonds) in an easy format. Technical analysis, sentiment indicators, seasonal patterns and common sense are all wrapped up into two or more easy-to-read weekly updates. All Profit Radar Report recommendations resulted in a 59.51% net gain in 2013 and 17.59% in 2014.
Follow Simon on Twitter @ iSPYETF or sign up for the FREE iSPYETF Newsletter to get actionable ETF trade ideas delivered for free.

If you enjoy quality, hand-crafted research, >> Sign up for the FREE iSPYETF Newsletter
|
