What’s the ‘Black Swan Canary?’ It’s the CBOE SKEW Index.
The SKEW Index is calculated by the CBOE. The CBOE, the same outfit responsible for the CBOE VIX.
According to CBOE, the SKEW Index is designed to measure the tail risk (= risk of outlier returns two or more standard deviations below the mean) of the S&P 500.
The SKEW Index basically estimates the probability of a large decline or ‘Black Swan’ event.
Complex Analysis Made Easy - Sign Up for the FREE iSPYETF E-Newsletter
Similar to the CBOE VIX or VIX Volatility Index (NYSEArca: VXX), the price of the S&P 500 (NYSEArca: SPY) tail risk is calculated from the price of S&P 500 out-of-the-money options.
The SKEW typically ranges from 115 to 135. Readings of 135+ suggest a 12% chance of a large decline (2 standard deviations). Readings of 115 or less suggest a 6% chance of a large decline.
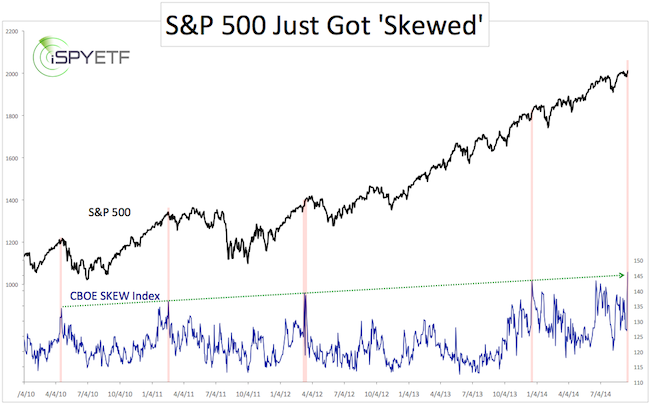
The highest SKEW reading was recorded on October 16, 1998 and was matched by last Friday’s spike to 146 (the chart below was originally published in Sunday's Profit Radar Report).
Here are probably the two most salient points about the SKEW/S&P 500 relationship:
-
The SKEW has established a sequence of higher highs. It has taken progressively higher SKEW readings to get the S&P 500 in trouble (134 in April 2010 was enough to ‘cause’ the ‘Flash Crash’. 143 in December 2014 only led to a minor eventual pullback).
-
Nevertheless, an elevated SKEW has tripped the S&P 500 (at least to some extent) every time. If this track record continues, Friday’s SKEW spike should cause some choppiness.
Although the 2010 and 2011 corrections were quite nasty, the label ‘Black Swan Index’ has been misleading in recent years.
This time may be different, but the SKEW has been one of the most accurate indicators in an environment that’s fooled many other trusted gauges.
The SKEW suggests a bumpy ride ahead with limited gains and elevated risk.
I always recommend looking at more than one indicator (I personally monitor various indicators from three different categories: Sentiment, seasonality and technicals).
The SKEW’s meaning is nicely enhanced by a simple Dow Jones (NYSEArca: DIA) chart. Right now a rare Dow formation offers clear levels of ruin and opportunity.
Simon Maierhofer is the publisher of the Profit Radar Report. The Profit Radar Report presents complex market analysis (S&P 500, Dow Jones, gold, silver, euro and bonds) in an easy format. Technical analysis, sentiment indicators, seasonal patterns and common sense are all wrapped up into two or more easy-to-read weekly updates. All Profit Radar Report recommendations resulted in a 59.51% net gain in 2013.
Follow Simon on Twitter @ iSPYETF or sign up for the FREE iSPYETF Newsletter to get actionable ETF trade ideas delivered for free.

|
