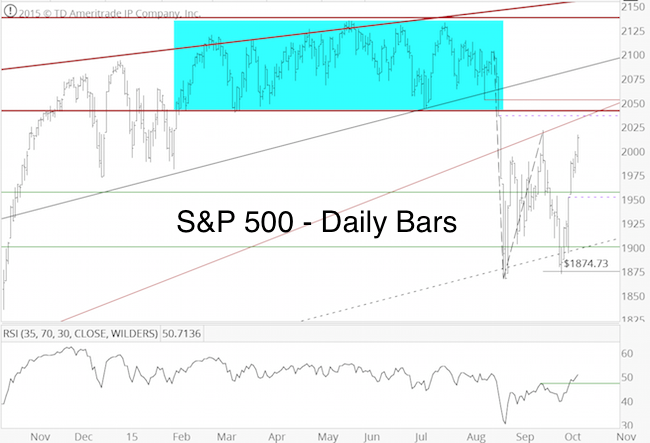
On September 29, the S&P 500 fell as low as 1,872. The following headlines popped up on the same day:
-
“We are in a bear market: Carter Worth” – CNBC
-
“Credit Suisse: There’s a growing treat of a major top in the S&P 500” – Bloomberg
-
“Despite rally, stocks won’t end higher in 2015: Blitzer” – CNBC
-
“Carl Icahn says would ‘keep cash’ given market risks” – CNBC
The S&P 500 soared 150 points since the September 29 low.
Based on our dashboard of indicators, we’ve been waiting for a buying opportunity.
The September 30 Profit Radar Report reconfirmed this outlook, and expressed our biggest concern:
“The market has been tracking our projections very well, too well. I get suspicious when this happens. Since we are waiting for an eventual buying opportunity, our biggest concern is the market moving higher without us ‘on board.’ Key short-term resistance is 1,953.”
The October 4 Profit Radar Report pointed out: “If the S&P doesn’t turn around at 1,953, the odds increase for a push to 2,040+/-.”
If you enjoy quality, hand-crafted research, >> Sign up for the FREE iSPYETF Newsletter
2,040+/- is our bull/bear line in the sand. Trade above 2,040 could lead to 2,075 (potential new highs thereafter), while trade below 2,040 preserves the ideal scenario of new lows. Additional resistance worth watching is around 2,075.

Why 2,040+/-?
-
2,040 was support for a 6-month trading range. This support is now resistance.
-
2,040 is the bottom of an important long-term trend line
-
There’s an open chart gap at 2,035. The September 13 Profit Radar Report wrote that: “There is an open chart gap at 2,035.73. I am almost certain this gap will be filled (either during a wave 4 bounce or the subsequent rally). Depending on when we get there, 2,040 is an obvious candidate for a setup. It may be too obvious and subject to some sort of whipsaw, but 2,040 is the resistance level to watch.”
-
Sustained trade above 2,030 could validate a W-bottom formation
As mentioned on September 13, 2,040 is a pretty obvious resistance level on the S&P chart, and therefore may be subject to whipsaw market action (if it’s too obvious, it’s obviously …?).
Because of the above-mentioned reason, the whole 2,040 region will be important, not just 2,040.
Furthermore, not just the price shown on the chart will matter, but also the market’s underlying condition. Is there hidden strength, or not? Is buying pressure overpowering selling, or is the advance anemic and susceptible to a relapse?
In other words, breath, strength and liquidity matter, and may give us clues that plain chart analysis won’t provide.
The Profit Radar Report monitors various breadth, strength and liquidity indicators to get a detailed look at what’s going on ‘under the hood.’
Buckle up. It's gonna be a rocky ride.
Simon Maierhofer is the publisher of the Profit Radar Report. The Profit Radar Report presents complex market analysis (S&P 500, Dow Jones, gold, silver, euro and bonds) in an easy format. Technical analysis, sentiment indicators, seasonal patterns and common sense are all wrapped up into two or more easy-to-read weekly updates. All Profit Radar Report recommendations resulted in a 59.51% net gain in 2013 and 17.59% in 2014.
Follow Simon on Twitter @ iSPYETF or sign up for the FREE iSPYETF Newsletter to get actionable ETF trade ideas delivered for free.

If you enjoy quality, hand-crafted research, >> Sign up for the FREE iSPYETF Newsletter
|