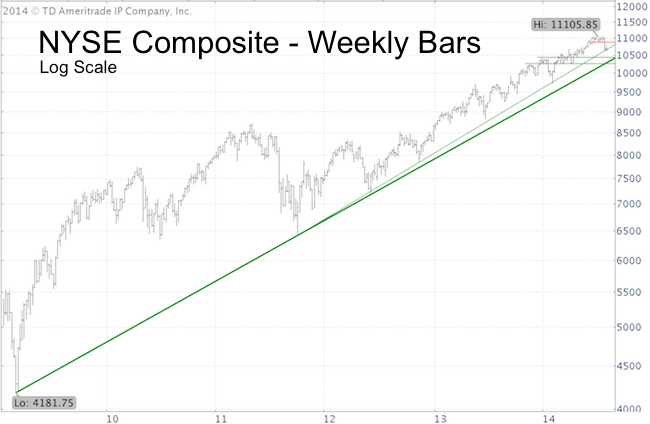
The NYSE Composite Index is not often discussed, but as one of the broadest U.S. indexes (1,868 components) it offers a unique big picture perspective, especially right now.
First off is a weekly log scale bar chart of the NYSE Composite since its March 2009 low along with some basic support/resistance levels and trend lines.

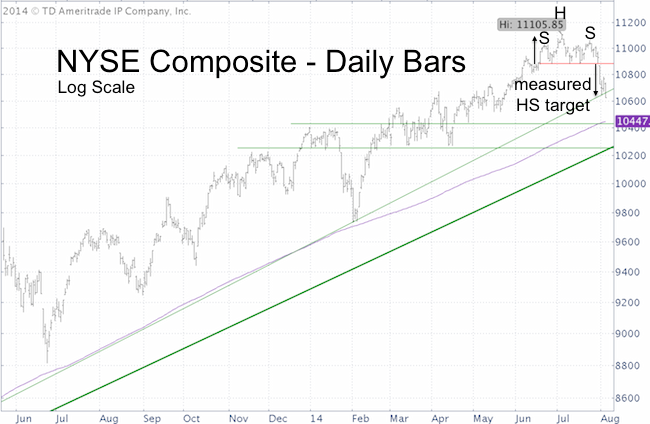
The second chart zooms in on the more recent price action.

There are a number of noteworthy developments:
There is a possible head-and shoulders top. The red line is the neckline. The projected target is 10,655, which was reached last week.
The measured HS target at 10,655 also coincides with green trend line support.
Despite the measured HS target having been fulfilled, the August 3 Profit Radar Report predicted another leg down.
The NYSE Composite (NYSEArca: NYC) already exceeded last weeks low and the measured HS down side target. Today it broke below last week’s low and first green trend line support.
What does this mean for the NYSE Composite?
It doesn't take a 'chart Sherlock' to perceive that the next leg down is underway.
While the trend is still down, the outlook is not as bleak as many expect. There is support at 10, 447 (200-day SMA) and 10,250.
From this support I expect a reaction that will surprise Wall Street and investors alike.
More details along with an actual projection for the S&P 500 are available via the Profit Radar Report.
Simon Maierhofer is the publisher of the Profit Radar Report. The Profit Radar Report presents complex market analysis (S&P 500, Dow Jones, gold, silver, euro and bonds) in an easy format. Technical analysis, sentiment indicators, seasonal patterns and common sense are all wrapped up into two or more easy-to-read weekly updates. All Profit Radar Report recommendations resulted in a 59.51% net gain in 2013.
Follow Simon on Twitter @ iSPYETF or sign up for the FREE iSPYETF Newsletter to get actionable ETF trade ideas delivered for free.

|