When is the best time to buy or sell the VIX or VIX ETFs/ETNs?
There are multiple ways to find decent entry points. The effectiveness of every single one of them can be enhanced by VIX seasonality.
Consider seasonality another layer of tradable information, just as you may use a mobile weather app to crosscheck what the meteorologist says on local TV.
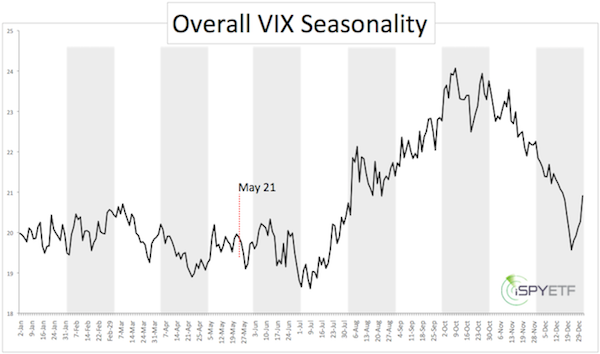
The VIX seasonality chart below is based on daily VIX data from 1990 – 2013 and was featured in the May 21 Profit Radar Report (Profit Radar Report subscribers get complimentary access to carefully crafted seasonality charts for the S&P 500, Apple, gold and VIX).

A major seasonal VIX low is usually due towards the beginning of July. Major tops tend to form in October.
Currently the VIX is flirting with a 7-year low. The iPath S&P 500 VIX ETN (NYSEArca: VXX) and VelocityShares 2x VIX ETN just slid to (another) all-time low.
Based on the VIX’s depressed level and spread between current trade and the 50-day and 200-day SMA, it’s almost certain (based on historic precedences) that VIX will climb towards 15 sometime before September.
It is tempting to buy the VIX at current levels (someone actually bought $13 million worth of VIX calls around 12, more below). Is this a good idea?
The VIX is trading just around support at 12 and a number of indicators suggest a S&P 500 correction. Lower S&P 500 (NYSEArca: SPY) generally translates into higher VIX.
However, the VIX seasonality chart cautions that we may see even lower VIX prices in early July. This doesn’t mean the VIX can’t rally now (based on some indicators it should rally), but seasonality cautions that any rally may be muted and/or reversed.
Odds of a successful trade increase if we get another chance to buy the VIX at depressed levels in a month or so.
Regardless of seasonality, one trader decided now is the time to load up on VIX calls, $13 million worth to be exact.
Seasonality does not yet support the bullish bet, but there are three other reasons suggesting some sleepless nights for the $13 million trader. More details here:
Record Gamble: Trader Spends $13 Million on Bullish VIX Bet
Simon Maierhofer is the publisher of the Profit Radar Report. The Profit Radar Report presents complex market analysis (S&P 500, Dow Jones, gold, silver, euro and bonds) in an easy format. Technical analysis, sentiment indicators, seasonal patterns and common sense are all wrapped up into two or more easy-to-read weekly updates. All Profit Radar Report recommendations resulted in a 59.51% net gain in 2013 and 17.59% in 2014.
Follow Simon on Twitter @ iSPYETF or sign up for the FREE iSPYETF Newsletter to get actionable ETF trade ideas delivered for free.

If you enjoy quality, hand-crafted research, >> Sign up for the FREE iSPYETF Newsletter
|