On April 24, the S&P 500 broke above its all-time high at 1,576. Since then the Profit Radar Report analysis has been focused on the Nasdaq-100. Why?
Unlike the S&P, the Nasdaq-100 (and its corresponding ETF, the PowerShares QQQ) trades well below its 2000 high. There are fewer resistance levels for the S&P 500 - an index trading at all-time highs – compared to the Nasdaq-100.
Support and resistance levels are effective tools to manage risk, so it made sense to switch ‘vehicles.’
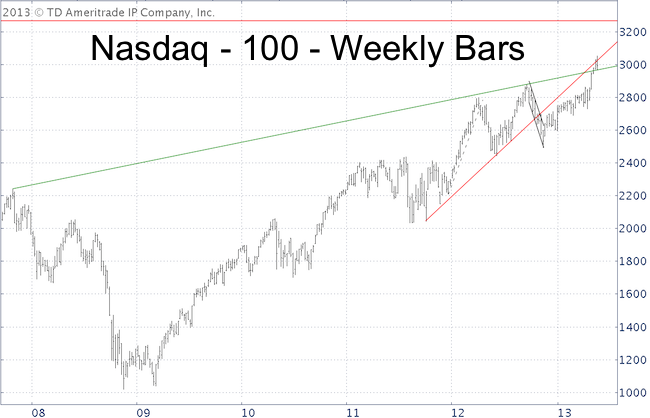
The weekly chart below shows the two trend lines we’ve been focusing on. The green trend line goes back to 2008 and is key support. The red trend line served as initial target and now early warning indicator.

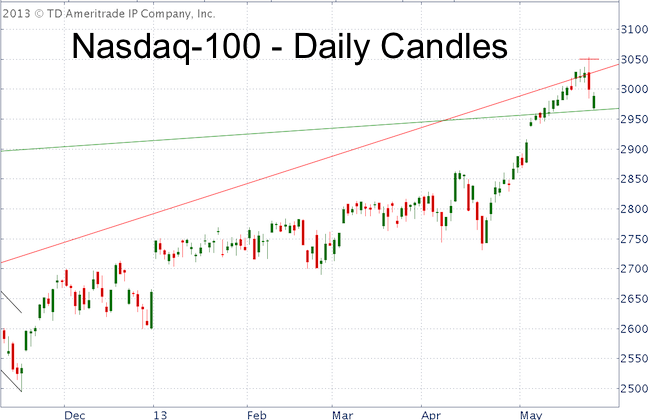
Wednesday’s giant red candle high (daily chart) looks significant for a number of reasons:

1) It’s a reversal candle that engulfs the four prior candles and occurred right against the long-term trend line as well as short-term resistance at 3,050.
2) Sentiment was getting too bullish: The May 19, Profit Radar Report warned that: “The increasing number of bullish polls and money flow indicators shows that risk is rising and we will be alert for a change of trend.”
3) Seasonality is about to turn sour as pointed out by the May 19, Profit Radar Report: “Based on post election seasonality stocks are due for a pullback in a week. VIX seasonality projects weakness for late May/early June.”
Reversal candles are not foolproof. For example, a reversal candle for the Dow on February 25 did no lasting damage.
But unlike the Dow’s February 25 candle, yesterday’s reversal was the common denominator of all major markets.
What’s Next?
We looked at the Nasdaq-100 because it gives us the support/resistance levels needed for risk management and low-risk buy/sell triggers. Let’s take advantage of them.
Prices often retest a previously broken support level, so a move up to the red trend line would be a low-risk opportunity to go short. A stop-loss should be used as a move above the red trend line would point to a continuation of the rally.
Selling tends to accelerate when support is broken (this was true with the red trend line). Therefore, a move below the green trend line would unlock lower targets.
Based on past experience, stocks should bounce to digest yesterday’s decline. There’s an open chart gap for QQQ at higher prices. At least that chart gap should be closed.
This week’s ETF SPY is more ‘special’ because it includes information generally reserved for subscribers to the Profit Radar Report. >> Sign up for the Profit Radar Report if you’d like to enjoy this kind of analysis.
If you don’t want to miss future editions of the Weekly ETF SPY, >> sign up for our FREE Newsletter.
|