2012 was a terrible year for Northern Michigan Cherry farmers. A hard freeze in late March did serious damage to the local cherry crop. What’s unusual about a hard freeze in winter?
Nothing really, and technically the freeze wasn’t the problem. It was the record-setting mid-March heat wave that coaxed out blossoms. Cherry trees started blooming when the freeze came and caused an 80-90% bud kill on Northern Michigan’s tart cherries.
Financial Climate Changes
Unprecedented climate changes are not only seen in weather patterns, they are also observed in financial patterns. The Federal Reserve’s ‘carbon footprint’ may be to blame for U.S. dollar/stock pattern shifts.
The U.S. dollar and stocks generally have an inverse teeter totter-like relationship. When the dollar goes up, stocks usually come down and vice versa.
The first chart plots the SPDR S&P 500 ETF (SPY) against the PowerShares DB US Bullish ETF (UUP). Green and red arrows are used to illustrate the inverse relationship between the S&P 500 (SPY) and the U.S. dollar (UUP).
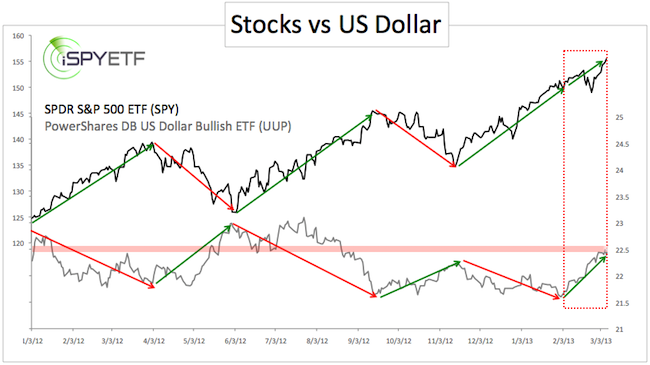
Every green trend arrow is matched by a corresponding red trend arrow and vice versa. Since February 2013 we are seeing two green arrows as the S&P and dollar are trending up.
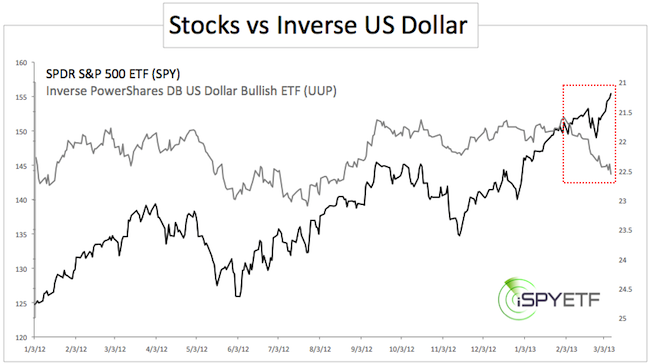
The second chart plots the SPY ETF against the inverse UUP to further illustrate the same point (plotting SPY against the euro or CurrencyShares Euro Trust – FXE – would yield similar results).
What Does This Mean?
UUP is about to run into resistance around 22.7 (the equivalent for the U.S. Dollar Index is 82.8 – 83.6). This is illustrated by the red range in the first chart. After a strong rally, the U.S. dollar is due for a breather.
The S&P 500 is not far away from an inverse head-and shoulders target around 1,565 in the all-time high at 1,576. This is strong resistance and should lead to some weakness, possibly even a larger reversal.
However, a falling dollar and declining stocks would still be contrary to the normal inverse correlation between stocks and the dollar.
This doesn’t mean it can’t happen, but it’s a missing piece to get a high probability signal (sell for stocks, buy for dollar). When historic correlations disagree with an overall decent trading opportunity, it’s prudent to be nimble and keep a tight leash on your positions.
|
