|
Gaining An Edge
Gamblers know; the house always wins. Nevertheless, they tirelessly look for ways to stack the odds in their favor.
Investors too are always searching for an edge, but investors have one advantage. There is no omnipotent house that always wins. Wall Street is a market place, not a casino.
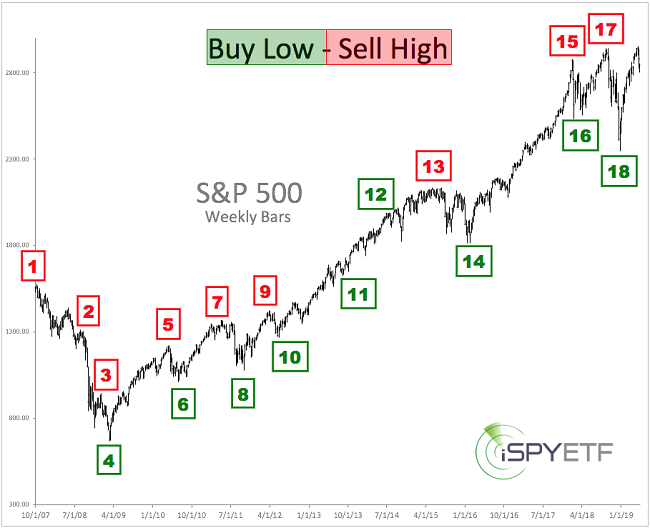
How to Make Money and Minimize Risk or How to ‘Outrun’ Your Fellow Investors
Investing - at its core - is a war of opinions. Every buy/sell transaction is a collision of two confliction opinions.
The buyer obviously believes it’s time to buy XYZ, while the seller thinks it’s time to sell XYZ. Both sides of the trade can’t be right at the same time. Somebody will regret their decision. How can you make sure it’s not you?
This joke has a humorous answer to a profound question:
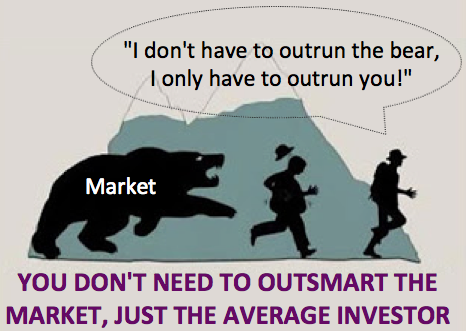
A bear jumps out of a bush and starts chasing two hikers. They both start running for their lives, but then one of them stops to put on his running shoes. "What are you doing? You can't outrun a bear!" says one hiker, the other one replies: "True, but I don't have to outrun the bear; I only have to outrun you!"
What's the point? The market is the composite opinion of all other investors. In essence, you beat 'the market' (aka the 'bear') by knowing more than your fellow investors (aka the other 'hiker').
The simple truth is that the best-informed investor has the best odds of winning.
Be the Best-informed Investor you Know (without spending a ton of time)
How can you become the best-informed investor you know? Become market wise.
Smart people learn from their own mistakes, wise people learn from other people's mistakes. Avoid costly errors and thrive when others dive. Picking up on little-known but effective market signals overlooked by most investors can be your edge.
That’s where the Profit Radar Report comes into play. The Profit Radar Report monitors and analyzes the most powerful stock market forces. There are four key market-moving powers. We call them the 'four stock market engines'.
The Four Stock Market Engines
- Supply & Demand (liquidity)
- Technical Analysis
- Investor Sentiment
- Seasonalities and Cycles
Supply & Demand: The price of nearly every product is determined by supply and demand. But how do you determine supply and demand for stocks? A simple price chart (let's say of the S&P 500) doesn't reveal whether buyers or sellers are in control, it only reveals price.
It's important to know that rising prices are not always a product of rising demand. In fact, buyers might be fleeing as prices rise. That's what happened prior to the 1987, 2000, and 2007 market crashes. Our supply and demand (or liquidity) indicators warned of 'buyers fatigue' prior to the 1987, 2000 and 2007 tops by revealing troubling tell tale signs invisible to most investors.
Of course, the opposite tends to happen near market bottoms. Internal buying pressure tends to build up even as stocks (or other assets) enter the final bear market leg. The best informed investors will notice that demand (buying pressure) is picking up just before stocks carve out their final low and bust higher (this is what happened in March 2009 and October 2011).
The liquidity indicators monitored by the Profit Radar Report detect conditions invisible on price charts and therefore unseen by the majority of investors. Those indicators allow investors to take a valuable 'look under the hood.'
Technical Analysis: Technical analysis includes support/resistance levels, Fibonacci levels, chart patterns, candle formations, Elliott Wave Theory, price projections, historic chart patterns, etc.
One of the many benefits of technical analysis is the ability to pinpoint important inflection points, turnaround zones and price targets. Being aware of key inflection points prevents 'stupid' decisions.
Stupid decisions are mistakes that could have been easily prevented. Such mistakes include selling stocks above support (technical support often sparks a rally). Or, buying stocks after support is broken (stock market declines tend to accelerate once technical support is broken). Stupid mistakes are the result of insufficient information (and often crowd behavior) and can easily be prevented.
Technical analysis allows investors to pick low-risk entry levels, increases confidence in any trade, and tends to prevent buying or selling at the worst of times.
The Profit Radar Report applies technical analysis to stocks, currencies, gold, silver, oil and various ETFs.
Investor Sentiment: Investor sentiment is a contrarian indicator. Excessive optimism tends to occur near market tops, excessive pessimism near market bottoms. Here is why it works:
Excessive investor optimism means that most investors already own stocks (because most buyers have already bought). This means that few buyers are left to drive prices higher. Without buyers, the market either pulls back or collapses. The same principle (in the opposite direction) applies to market bottoms.
What constitutes a true sentiment extreme? The Profit Radar Report measures dozens of sentiment gauges to get a comprehensive, broad-based sentiment picture for stocks and other asset classes.
Seasonalities & Cycles: Seasonal patterns and cycles are carved out by many decades of trading activity. Some seasonal patterns are more pronounced than others. Stocks, gold, silver, oil, gas and the VIX have at least one or two must know seasonal strong and weak spots.
The Profit Radar Report providess hand-crafted seasonality charts for the S&P 500, euro, gold, silver, oil, gas, treasuries and certain ETFs.
High Probability Signals
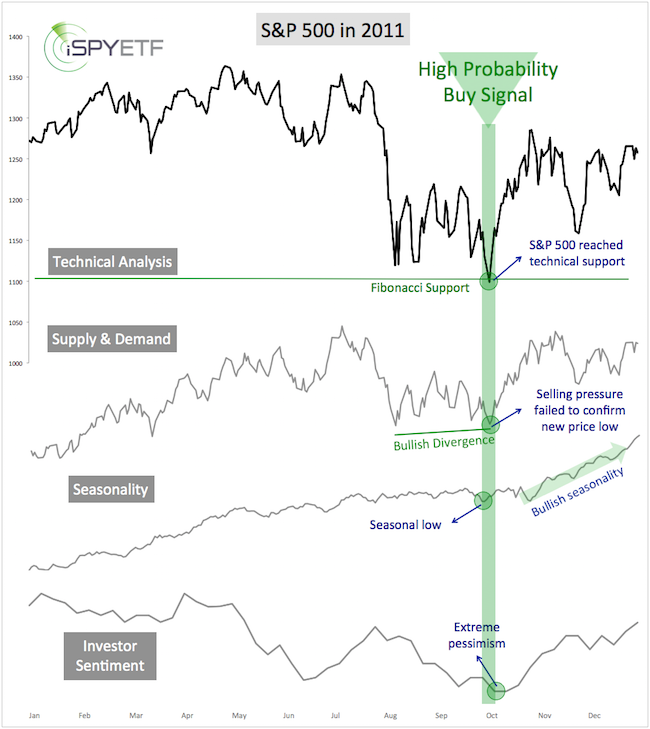
True to its name, a high probability signal comes with very high odds of being accurate. It occurs when all four market moving engines point in the same direction. Such signals include: SELL in October 2007, BUY in March 2009, BUY in October 2011.
The chart below visually illustrates the October 2011 buy signal at S&P 1,088 on October 4, 2011. Technical analysis, supply & demand, seasonality and investor sentiment all converged for a strong high probability buy signal.
Benefit of the "4 Stock Market Engines"
The purpose of monitoring hundreds of data points (which make up the 4 stock market engines) is to identify a common consensus created by a confluence of indicators. This increases confidence in the direction of the next move.
Conflict among the four engines (like in late 2014 and 2015) often results in trading ranges. Trading ranges or obviously more difficult to navigate, but anticipating an upcoming trading range contributes to more effective money and risk management.
Complex Analysis Made Easy
Monitoring the four stock market engines doesn't have to be time consuming. The Profit Radar Report boils down an avalanche of information into a few drops of meaningful research and actionable advice.
Profit Radar Report updates are posted a minimum of twice a week (Sunday and Wednesday evening, additional updates on an 'as needed' basis). Each update consists of 200 – 1000 words of analysis and powerful charts.
Being informed about the 'four stock market engines' will probably make you the best-informed investor you know. Start gaining your edge now.
>> Test-drive the Profit Radar Report risk free
>> Performance Track Record
|