| |
Articles
 |
By Simon Maierhofer | Tuesday March 06, 2018
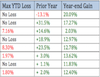
Seasonality is one of 4 key indicators we analyze (the other 3 are: Money flow, technicals, and investor sentiment). Out of many seasonal patterns, this is probably the most important one for all of 2018.... >> READ MORE...
|
| |
 |
By Simon Maierhofer | Thursday March 01, 2018
February saw one of the fastest corrections in stock market history followed by one of the fastest snap back rallies ever. One key question is whether the February 9 panic low at 2,533 will be broken or not? ... >> READ MORE...
|
| |
 |
By Simon Maierhofer | Thursday February 15, 2018
On February 9, the S&P 500 touched the 200-day SMA – and more importantly – the 38.2% Fibonacci retracement support level. Now the S&P is near another key Fibonacci level. Relapse or new highs? It’s decision time! ... >> READ MORE...
|
| |
 |
By Simon Maierhofer | Wednesday February 07, 2018
S&P 500 futures dropped as much as 12.14% in seven days, displaying signs of panic. Is this February mini meltdown a warning signal of worse things to come or a buying opportunity?... >> READ MORE...
|
| |
 |
By Simon Maierhofer | Wednesday January 24, 2018
For well over a year, the S&P 500 traded in the ‘sweet spot zone. The January burst propelled the S&P 500 from ‘not too hot’ to ‘hot.’ The surprising implication of a ‘hot’ January start are discussed here:... >> READ MORE...
|
| |
 |
By Simon Maierhofer | Tuesday January 09, 2018
2017 was one of the most unique years ever, and 2018 has started even more spectacular than 2018. Does that mean 2018 will replicate a 2017-like performance, or will we finally see a 10% +/- correction?... >> READ MORE...
|
| |
 |
By Simon Maierhofer | Wednesday November 29, 2017
The dollar, euro, gold and silver have been stuck in multi-month trading ranges. Gold could be staging a (deceptive?) breakout, while the dollar and euro are likely to trigger a solid signal in the not so distant future.... >> READ MORE...
|
| |
 |
By Simon Maierhofer | Tuesday November 28, 2017
The October 1 Profit Radar Report warned that: “Stocks grind higher for a number of weeks in a 2 steps forward, 1 step back pattern. A real unexciting, unstimulating and uninspiring grind higher to 2,600+/-.” What now?... >> READ MORE...
|
| |
 |
By Simon Maierhofer | Tuesday October 24, 2017
True or false? Since the Great Depression there’s never been a rally that’s gone longer without a 3% pullback than the current one. The answer along with the next up side target for this rally is found here.... >> READ MORE...
|
| |
 |
By Simon Maierhofer | Thursday September 28, 2017
Gold has been zigzagging up and down for all of 2017. This erratic performance brings a measure of uncertainty, but – in a way - it also increases confidence in our long-term forecast.... >> READ MORE...
|
| |
|
Previous | 20 | 21 | 22 | 23 | 24 | 25 | 26 | 27 | 28 | 29 Next
|
|
|
|
